AFNI (Analysis of Functional NeuroImages) includes SUMA (Surface Mapping with AFNI) for displaying brains in 3D. AFNI already includes a 3D Render plugin (shown below), capable for displaying fMRI results in 3D. But SUMA offers a few additional benefits, not the least of which is the ability to click and rotate the image by hand instead of typing in values for Roll, Pitch, and Yaw!
I use SUMA for three major tasks: 1) Displaying fMRI results on 3D brain surfaces; 2) Analyzing fMRI data on the surface, taking into account the cortical folding patterns for smoothing; and 3) Displaying DTI Tracts in 3D. These aren’t the only things you can use SUMA for, that list is quite long. But in the interest of having a long, but still manageable blog post, we’ll look at the first two cases.
Preparing to use SUMA
Before you can use SUMA, you will need to generate surfaces using one of: 1) Freesurfer; 2) Surefit/Caret; 3) BrainVoyager. I mostly use Freesurfer (see this post for parallelizing the processing), since it is free, and it was what I learned first. Caret is also free, but requires a bit more manual editing before creating the surfaces. BrainVoyager is not free, but has the advantage of generating the necessary brain surfaces very very quickly.
Using Freesurfer in this case: Once you have generated the surfaces, you need to run @SUMA_Make_Spec_FS from within each Freesurfer folder. This will generate a SUMA folder for each subject, which we will use for displaying the fMRI results. Before moving on, it is important to verify that your surfaces are correctly aligned to your anatomical images, at the end of @SUMA_Make_Spec_FS is a command for opening both AFNI and SUMA.
afni -niml &
suma -spec Subject001_both.spec -sv Subject001_SurfVol_ns+orig
Clicking around in SUMA will show the matched vertices in AFNI. If you notice any gross misalignments, you should try to fix them inside of Freesurfer (or the software your constructed your surfaces in). Finally, I copy this SUMA folder into the same directory as my fMRI data for convenience. My final file structure looks something like:
Subject001
--anat
--func
--SUMA
--stim_times
This makes performing analyses somewhat easier. For the following examples, I used afni_proc.py to process fMRI data both in the volume (the usual way in AFNI) and also on the surface. I can display either of these results on the surface. My afni_proc.py script below will sinc interpolate the data, perform motion correction, align the EPI to the anatomical, perform smoothing to a final smoothness of 10mm, calculate a mask, scale the data to % signal change, and perform the regression analysis while censoring outliers and TRs with high amounts of motion.
afni_proc.py -subj_id ${x} -script afni_${x}_auditory.tcsh -out_dir ${x}.auditory \
-dsets func/*ep2dbold*.nii.gz \
-do_block align tlrc \
-copy_anat anat/*Sag3DMPRAGE*.nii.gz \
-tshift_opts_ts -tpattern alt+z2 \
-tcat_remove_first_trs 6 \
-volreg_align_e2a -volreg_align_to first \
-align_opts_aea -giant_move \
-blur_size 10 -blur_to_fwhm -blur_in_automask \
-regress_stim_times stim_times/a_times* \
-regress_stim_labels word psw \
-regress_local_times \
-regress_reml_exec \
-regress_basis 'GAM' \
-regress_censor_outliers 0.1 \
-regress_censor_motion 0.3 \
-regress_est_blur_epits \
-regress_est_blur_errts \
-regress_opts_3dD \
-num_glt 3 \
-gltsym 'SYM: +word' -glt_label 1 'word' \
-gltsym 'SYM: +psw' -glt_label 2 'psw' \
-gltsym 'SYM: +word +psw' -glt_label 3 'speech' \
-jobs 8 \
-bash -execute
Displaying fMRI Results using SUMA
Having processed the data in AFNI, I can display the results on the surfaces using SUMA. To do this, I’ll need to align the subject anatomical (afni_proc.py calls this anat_final+orig) to the Surface anatomical (SUMA calls this Subject001_SurfVol_ns+orig.HEAD). To align the two, you need to call AlignToExperiment using the following command:
@SUMA_AlignToExperiment -exp_anat anat_final.Subject001+orig.HEAD -surf_anat ../SUMA/Subject001_SurfVol_ns+orig.HEAD
Next, you can display the results. Open AFNI inside of your afni_proc.py output directory (in this case: Subject001.auditory), start niml as you do so:
cd Subject001.auditory
afni -niml &
Next in AFNI, set your underlay as Subject001_SurfVol_Alnd_Exp+orig and launch SUMA, giving it the spec and surface volume as arguments:
suma -spec ../SUMA/Subject001_both.spec -sv Subject001_SurfVol_Alnd_Exp+orig.
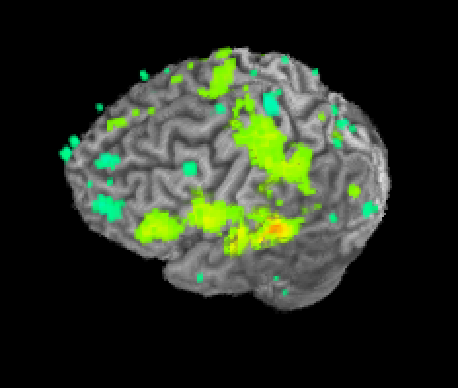
Once SUMA is open, you can press the “t” key to initiate communication between the two programs. Once this is finished, go back to AFNI and set your overlay as your stats.subject001+orig dataset and set the sub-briks as you normally would. In this case I’ll use the “Speech#0_Tstat” as both my Olay and Thr. You will see in the statistics image displayed in SUMA, shown below on my data.

Processing fMRI data on the Surface using SUMA
The above example makes for nice images, but doesn’t take full advantage of the fact that we know the folding pattern of the cortex. If we add just a few lines in our afni_proc.py script, our smoothing can be performed on the surface. In the volume I had specified a final FWHM smoothing. When running analysis on the surface, this is done automatically so we drop the “-blur_to_fwhm -blur_in_automask”. We also need to tell afni_proc.py to skip the mask step and to add a surf block for performing the alignment of the EPI to the surfaces.
-out_dir ${x}.SUMAauditory
-blocks tshift align volreg surf blur scale regress
-blur_size 10
-surf_anat SUMA/${x}_SurfVol+orig.HEAD \
-surf_spec SUMA/std.141.${x}_?h.spec \
Once the processing has completed, you can launch SUMA directly:
cd Subject001.SUMAauditory
suma -spec ../SUMA/tb4982_both.spec -sv tb4982_SurfVol_Alnd_Exp+orig.
At this point right-click on one hemisphere in SUMA and press control+s to open the Surface Controller. Use Load Dset and select your stats.lh.Subject001.niml.dset. SUMA will automatically load the right hemisphere stats dataset as well. Set your threshold and see the results.
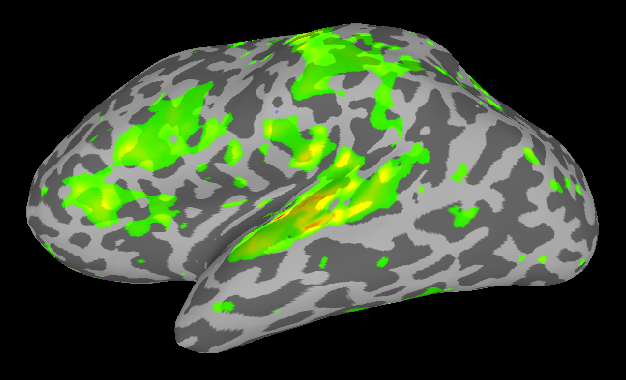
Comparison of analyses in Volume and on Surface

If you put the images from processing in the volume (right) and on the surface (left) side by side, you will see some differences related mostly to smoothing. In the next SUMA related post, I’ll talk about Group Analyses.