There are plenty of points in ERP data analysis that can be subjective. But that doesn’t mean that they have to be! One subjective point is determining the noise level of your subjects. If you’re using Net Station (EGI), you can check an option in the “Averaging” Waveform tool to calculate noise estimates. This will take every other trial in the ERP and flip it in polarity (negative to positive, positive to negative) and then average the trials together. The concept is that all of the systematic brain activity should average to 0 after this flipping and the remainder in the waveform is noise. But at this point you have 128 or more channels of “noise estimates” that span the full epoch of the ERP.
A very simple way to handle this data is to average each subject over time and then across all electrodes, this will give you an average “noise level” for the entire epoch for all channels. You can do this computation in R if you export all of your files to text format with the code below. In this example I have 8 subjects, with two conditions each. R will read the files in by subject, so complex and then simple conditions and then move to the next subject. These will be concatenated into an R list object, which can then be further processed.
In this code I first average over the time points, though really this doesn’t matter as much, you will get the same value if you first average over the columns instead of the rows. Next I get an average value for each subject, convert it to a data frame and add labels so that I can easily plot the data.
setwd('.')
all_erps = list.files('.', pattern='.txt')
#reads all files and puts them into a list
ave = lapply(all_erps, function(x) {
read.table(x, sep='\t', header=F)
} )
#get average for each electrode
time_average=sapply(ave, function(y) {
apply(y, 1, mean)
})
#get average per subject over all time points
subject_average=apply(time_average, 2, mean)
#convert to dataframe
subject_average = data.frame(subject_average)
#add condition labels
subject_average$cond = rep(c('complex','simple'))
#rename this columns
names(subject_average)[1] = 'value'
#plot the data
library(ggplot2)
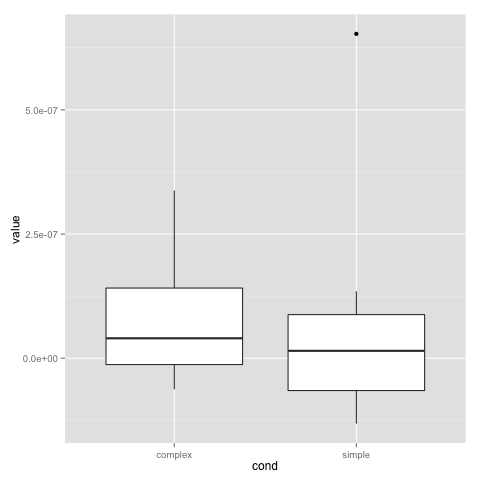
ggplot(subject_average, aes(x=cond, y=value)) + geom_boxplot()
#find outliers
max(subject_average$value) #show max value
which.max(subject_average$value) #show index of max value
If you have a channel of interest you can look at the noise levels just in that area. Once you have the plot and the index of the outlier, you can track down the subject that has the outlier and exclude it from further processing. Example plot below.
1 Comment