Displaying fMRI results on Surfaces with SUMA

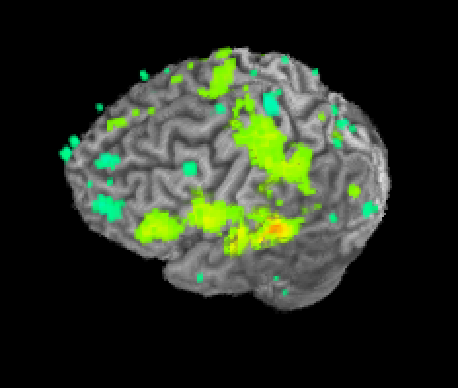
AFNI (Analysis of Functional NeuroImages) includes SUMA (Surface Mapping with AFNI) for displaying brains in 3D.  AFNI already includes a 3D Render plugin (shown below), capable for displaying fMRI results in 3D.  But SUMA offers a few additional benefits, not the least of which is the ability to click and rotate the image by hand instead of typing in values for Roll, Pitch, and Yaw!

Render

I use SUMA for three major tasks: 1) Displaying fMRI results on 3D brain surfaces; 2) Analyzing fMRI data on the surface, taking into account the cortical folding patterns for smoothing; and 3) Displaying DTI Tracts in 3D.  These aren’t the only things you can use SUMA for, that list is quite long.  But in the interest of having a long, but still manageable blog post, we’ll look at the first two cases.

Preparing to use SUMA

Before you can use SUMA, you will need to generate surfaces using one of: 1) Freesurfer; 2) Surefit/Caret; 3) BrainVoyager.  I mostly use Freesurfer (see this post for parallelizing the processing), since it is free, and it was what I learned first.  Caret is also free, but requires a bit more manual editing before creating the surfaces.  BrainVoyager is not free, but has the advantage of generating the necessary brain surfaces very very quickly.

Using Freesurfer in this case: Once you have generated the surfaces, you need to run @SUMA_Make_Spec_FS from within each Freesurfer folder.  This will generate a SUMA folder for each subject, which we will use for displaying the fMRI results.  Before moving on, it is important to verify that your surfaces are correctly aligned to your anatomical images, at the end of @SUMA_Make_Spec_FS is a command for opening both AFNI and SUMA.

afni -niml &
suma -spec Subject001_both.spec -sv Subject001_SurfVol_ns+orig

Clicking around in SUMA will show the matched vertices in AFNI.  If you notice any gross misalignments, you should try to fix them inside of Freesurfer (or the software your constructed your surfaces in).  Finally, I copy this SUMA folder into the same directory as my fMRI data for convenience.  My final file structure looks something like:

Subject001
--anat
--func
--SUMA
--stim_times

This makes performing analyses somewhat easier.  For the following examples, I used afni_proc.py to process fMRI data both in the volume (the usual way in AFNI) and also on the surface.  I can display either of these results on the surface.  My afni_proc.py script below will sinc interpolate the data, perform motion correction, align the EPI to the anatomical, perform smoothing to a final smoothness of 10mm, calculate a mask, scale the data to % signal change, and perform the regression analysis while censoring outliers and TRs with high amounts of motion.

afni_proc.py -subj_id ${x} -script afni_${x}_auditory.tcsh -out_dir ${x}.auditory \
-dsets func/*ep2dbold*.nii.gz \
-do_block align tlrc \
-copy_anat anat/*Sag3DMPRAGE*.nii.gz \
-tshift_opts_ts -tpattern alt+z2 \
-tcat_remove_first_trs 6 \
-volreg_align_e2a -volreg_align_to first \
-align_opts_aea -giant_move \
-blur_size 10 -blur_to_fwhm -blur_in_automask \
-regress_stim_times stim_times/a_times* \
-regress_stim_labels word psw \
-regress_local_times \
-regress_reml_exec \
-regress_basis 'GAM' \
-regress_censor_outliers 0.1 \
-regress_censor_motion 0.3 \
-regress_est_blur_epits \
-regress_est_blur_errts \
-regress_opts_3dD \
-num_glt 3 \
-gltsym 'SYM: +word' -glt_label 1 'word' \
-gltsym 'SYM: +psw' -glt_label 2 'psw' \
-gltsym 'SYM: +word +psw' -glt_label 3 'speech' \
-jobs 8 \
-bash -execute

Displaying fMRI Results using SUMA

Having processed the data in AFNI, I can display the results on the surfaces using SUMA.  To do this, I’ll need to align the subject anatomical (afni_proc.py calls this anat_final+orig) to the Surface anatomical (SUMA calls this Subject001_SurfVol_ns+orig.HEAD).  To align the two, you need to call AlignToExperiment using the following command:

@SUMA_AlignToExperiment -exp_anat anat_final.Subject001+orig.HEAD -surf_anat ../SUMA/Subject001_SurfVol_ns+orig.HEAD

Next, you can display the results.  Open AFNI inside of your afni_proc.py output directory (in this case: Subject001.auditory), start niml as you do so:

cd Subject001.auditory
afni -niml &

Next in AFNI, set your underlay as Subject001_SurfVol_Alnd_Exp+orig and launch SUMA, giving it the spec and surface volume as arguments:

suma -spec ../SUMA/Subject001_both.spec -sv Subject001_SurfVol_Alnd_Exp+orig.

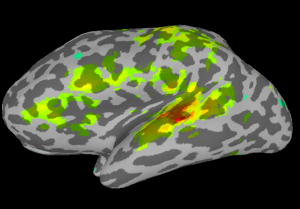
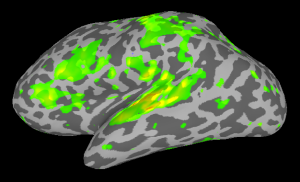
Once SUMA is open, you can press the “t” key to initiate communication between the two programs.  Once this is finished, go back to AFNI and set your overlay as your stats.subject001+orig dataset and set the sub-briks as you normally would.  In this case I’ll use the “Speech#0_Tstat” as both my Olay and Thr.  You will see in the statistics image displayed in SUMA, shown below on my data.

afni_suma

Processing fMRI data on the Surface using SUMA

The above example makes for nice images, but doesn’t take full advantage of the fact that we know the folding pattern of the cortex.  If we add just a few lines in our afni_proc.py script, our smoothing can be performed on the surface.  In the volume I had specified a final FWHM smoothing.  When running analysis on the surface, this is done automatically so we drop the “-blur_to_fwhm -blur_in_automask”.  We also need to tell afni_proc.py to skip the mask step and to add a surf block for performing the alignment of the EPI to the surfaces.

-out_dir ${x}.SUMAauditory
-blocks tshift align volreg surf blur scale regress
-blur_size 10
-surf_anat SUMA/${x}_SurfVol+orig.HEAD \
-surf_spec SUMA/std.141.${x}_?h.spec \

Once the processing has completed, you can launch SUMA directly:

cd Subject001.SUMAauditory
suma -spec ../SUMA/tb4982_both.spec -sv tb4982_SurfVol_Alnd_Exp+orig.

At this point right-click on one hemisphere in SUMA and press control+s to open the Surface Controller.  Use Load Dset and select your stats.lh.Subject001.niml.dset.  SUMA will automatically load the right hemisphere stats dataset as well.  Set your threshold and see the results.

suma_suma


Comparison of analyses in Volume and on Surface

comparison

If you put the images from processing in the volume (right) and on the surface (left) side by side, you will see some differences related mostly to smoothing.  In the next SUMA related post, I’ll talk about Group Analyses.
Connectivity Analysis in AFNI (Part 1)

I’ve written before about how AFNI offers users the ability to perform the same or very similar analyses using a variety of tools.  Performing connectivity analysis is no different.  First of all, most people who are talking about connectivity are really referring to “seed connectivity” (sometimes called functional connectivity or fcMRI), whereby one region of the brain is correlated with all other regions of the brain.  This is in contrast to “network analysis” (also called effective connectivity), which is usually done via Structural Equation Modeling (SEM), Granger Causality, or Dynamic Causal Modeling (DCM).

The plan is that today’s post is about “seed connectivity”.  The next post will cover InstaCorr and 3dGroupInCorr, the amazing AFNI programs for seeing real-time correlations.  And we’ll leave the network analysis for later posts.

The following examples are simple cases performed on resting-state data.  If you wished to remove events from event-related data, you can do that via 3dSynthesize.  Finally, before performing these analyses on your data, you will likely want to move your functional data to a standard space using @auto_tlrc or auto_warp.py.

Correlating two ROIs

The first thing you can do in AFNI is correlate two ROIs.  The easiest way to do this is first extract your ROIs as 1D (Text) files using 3dmaskave (alternatives include 3dROIstats, 3dmaskdump).  You can then use 1dCorrelate, 1ddot, or even 3ddot to compute a correlation between those two ROIs.  In the sample below, I created two ROIs and then exported them via 3dmaskave to the text files ROI1.1D and ROI2.1D.  The examples below show these are the input files.

1dCorrelate

1dCorrelate ROI1.1D ROI2.1D 

# Pearson correlation [n=150 #col=2]
# Name Name Value BiasCorr 2.50% 97.50% N: 2.50% N:97.50%
# ---------- ---------- -------- -------- -------- -------- -------- --------
 ROI1.1D[0] ROI2.1D[0] +0.96900 +0.96993 +0.39512 +0.99150 +0.95741 +0.97746

1ddot

1ddot -dem ROI1.1D ROI2.1D
++ 1ddot input vectors:
00..00: ROI1.1D
01..01: ROI2.1D
++ Correlation Matrix:
00 01 
--------- ---------
00: 1.00000 0.96899
01: 0.96899 1.00000
++ Eigensolution of Correlation Matrix:
0.03101 1.96899
--------- ---------
00: 0.70711 0.70711
01: -0.70711 0.70711
++ Correlation Matrix Inverse:
00 01 
--------- ---------
00: 16.38033 -15.87245
01: -15.87245 16.38033
++ Correlation sqrt(diagonal)
4.04726 4.04726
++ Correlation Matrix Inverse Normalized:
00 01 
--------- ---------
00: 1.00000 -0.96899
01: -0.96899 1.00000

3ddot

3ddot -demean ROI1.1D ROI2.1D 
0.968995

R – Using the R environment to calculate the correlation.  Here we put the two ROIs into one file for ease of importing, read the data into R and then run cor.test() on those two columns of the data.frame.

1dcat ROI1.1D ROI2.1D > ROI_all.1D
R
thedata = read.table('ROI_all.1D', header=F, sep=' ')
cor.test(thedata$V2, thedata$V3)
Pearson's product-moment correlation
data: thedata$V2 and thedata$V3
t = 47.7105, df = 148, p-value < 2.2e-16
alternative hypothesis: true correlation is not equal to 0
95 percent confidence interval:
0.9574125 0.9774636
sample estimates:
cor 
0.9689949

Correlating seed to whole-brain

If you wish to correlate one seed region to the rest of the brain, you also have a few options.  Mainly you can use 3dfim+, 3dDeconvolve, or 3dTcorr1D.  The major advantages of using 3dDeconvolve are that you can also model the effects of non-interest (e.g. baseline, motion, respiration/heartbeat).  In these examples, minor differences may be found due to the overall design matrix including different baseline measures by default or the inclusion of extra regressors (e.g. motion).

3dfim+

3dfim+ -input ep2dbold150Restings011a001.nii.gz -ideal_file ROI2.1D -out Correlation -bucket fim_data

3dTcorr1D

3dTcorr1D -pearson -prefix corr1_data ep2dbold150Restings011a001.nii.gz ROI2.1D

3dDeconvolve

In this (admittedly very simple) example we run 3dDeconvolve, and then take the R-squared bucket and take the square root to get a correlation, getting the sign from the beta-weight.  You would likely wish to include motion regressors, etc.   I would recommend using afni_proc.py and modifying the 3dDeconvolve output to include a stim_file for your ROI.

3dDeconvolve -input ep2dbold150Restings011a001.nii.gz -polort 1 -num_stimts 1 -stim_file 1 ROI2.1D -rout -bucket decon_data
3dcalc -a 'decon_data+orig.[Stim#1_R^2]' -b 'decon_data+orig.[Stim#1#0_Coef]' -prefix decon_corr -expr 'ispositive(b)*sqrt(a)-isnegative(b)*sqrt(a)'

You can find more direct comparisons between 3dDeconvolve and 3dfim+ on Gang Chen’s page.  Next time we’ll go into how you can see real-time correlations in AFNI without doing all of this leg work.

Finding ERP Noise Outliers

There are plenty of points in ERP data analysis that can be subjective.  But that doesn’t mean that they have to be!  One subjective point is determining the noise level of your subjects.  If you’re using Net Station (EGI), you can check an option in the “Averaging” Waveform tool to calculate noise estimates.  This will take every other trial in the ERP and flip it in polarity (negative to positive, positive to negative) and then average the trials together.  The concept is that all of the systematic brain activity should average to 0 after this flipping and the remainder in the waveform is noise.  But at this point you have 128 or more channels of “noise estimates” that span the full epoch of the ERP.

A very simple way to handle this data is to average each subject over time and then across all electrodes, this will give you an average “noise level” for the entire epoch for all channels.  You can do this computation in R if you export all of your files to text format with the code below.  In this example I have 8 subjects, with two conditions each.  R will read the files in by subject, so complex and then simple conditions and then move to the next subject.  These will be concatenated into an R list object, which can then be further processed.

In this code I first average over the time points, though really this doesn’t matter as much, you will get the same value if you first average over the columns instead of the rows.  Next I get an average value for each subject, convert it to a data frame and add labels so that I can easily plot the data.

setwd('.')
all_erps = list.files('.', pattern='.txt')
#reads all files and puts them into a list
ave = lapply(all_erps, function(x) { 
 read.table(x, sep='\t', header=F)
 } )

#get average for each electrode
time_average=sapply(ave, function(y) { 
 apply(y, 1, mean)
})

#get average per subject over all time points
subject_average=apply(time_average, 2, mean)

#convert to dataframe
subject_average = data.frame(subject_average)

#add condition labels
subject_average$cond = rep(c('complex','simple'))

#rename this columns
names(subject_average)[1] = 'value'

#plot the data
library(ggplot2)
ggplot(subject_average, aes(x=cond, y=value)) + geom_boxplot()

#find outliers
max(subject_average$value) #show max value
which.max(subject_average$value) #show index of max value

If you have a channel of interest you can look at the noise levels just in that area.  Once you have the plot and the index of the outlier, you can track down the subject that has the outlier and exclude it from further processing.  Example plot below.

outlier

Rotating bvecs for DTI fitting

Update: While these methods continue to be useful, I now recommend using TORTOISE for preprocessing DTI.  The TORTOISE pipeline includes methods for (among other things) reducing distortions from EPI artifacts, eddy current correction, correcting for motion, rotating b-vecs, and co-registration to an anatomical image.  There are instructions for using the newest version here.  

Most people agree that it’s important to perform some type of motion correction or eddy correction before fitting tensors for DTI data.  However, it’s not always clear that you need to rotate the bvecs in response to the motion correction.  In fact, rotating the bvecs is highly recommended (link).  I’ve searched the internet and found a few different opinions on how to rotate the gradient vectors.  Some posts suggest that you don’t really need to rotate because the difference is usually small.  One post on the FSL mailing (link) list suggest that you should perform a 6 degrees of freedom (dof) transform to the b0 image and rotate your bvecs in relation to that transform before doing a 12 dof transform to deal with the other distortions.  I found a an older post on the AFNI message board (link) that details one method of rotating the bvecs.  In my tests, this method works fairly well with DWI data will relatively little motion.

I decided to rewrite the script from the AFNI Message Board in Bash (instead of tcsh).  So if you’re looking to do this rotation inside of the AFNI pipeline that I’ve detailed in the past posts (one, two), you can use the following script to rotate your bvec files after running the alignment via align_epi_anat.py.  I assume that your bvec.1D file is organized as three columns; if this is not the case, you should use 1dtranspose to rotate your bvec file (this is usually the case if you used dcm2nii to convert your DICOMs).

#!/bin/bash

#Usage: sh rotate_bvecs.sh bvec.1D dwi_al_reg_mat.aff12.1D

echo "bvec: $1"
echo "matrix: $2" 

nRows=`cat $2 | wc -l`
nRows=$(expr $nRows - 1)
echo "Number of Gradient Vectors: $nRows"

for aRow in `count -digits 3 0 $nRows`
do
 echo $aRow
 #separate bvecs
 1dcat $1{$aRow} > tmp.bvecs.${aRow} 
 #separate matrix
 1dcat $2{$aRow} > tmp.transform.${aRow} 
 #change to matrix from ONELINE
 cat_matvec tmp.transform.${aRow} > tmp.transform.mat.${aRow} 
 #get rid of translational shifts
 1dcat tmp.transform.mat.${aRow}[0..2] > tmp.transform.mat.s.${aRow}
 echo "0 0 0" > tmp.zero_fill.1D
 1dcat tmp.transform.mat.s.${aRow} tmp.zero_fill.1D\' > tmp.transform.final.${aRow}
 Vecwarp -matvec tmp.transform.final.${aRow} -input tmp.bvecs.${aRow} -forward >> bvec_rotated.1D
done

rm tmp.*

This script takes two arguments, the bvec and the “reg” matrix from align_epi_anat.py (DTI –> Anat transform).  It will separate the bvec and registration matrices into “line” per sub-brik, convert the one-line transform to a matrix, trim out the translational part of the matrix (by filling in 0’s), and then use Vecwarp to apply the matrix to the bvec and output a bvec_rotated.1D that can be used in 3dDWItoDT.

Creating AFNI images via command line and Xvfb

Quite a while ago, I wrote a post about making automated snapshots of MRI activation with AFNI.  One of the things I always appreciated about FSL was that they provided a series of ready-made images to show off where activation was in the brain for a given analysis (at least using FEAT).

So when I started using AFNI,  I wanted a quick way to show the activation of various contrasts without necessarily having to open AFNI for each subject, setting the sub-brik and threshold, and taking a screen shot.  Fortunately, AFNI comes with a tool called the plugout_drive, which allows you to “remote control” the AFNI user interface by setting various elements.  An impotant note, the plugout_drive can be controlled by either a separate program, or through the command used to Launch AFNI.  In this example I use the driver as part of opening AFNI to keep things shorter.  

The plugout_drive works really well for making the entire process hands free, but when you are creating automated snapshots for say 100 subjects, things get clunky for two reasons: 1) it takes a while; 2) AFNI opening and closing will grab your screen away from you making the computer mostly unusable while the process is taking place.  Well we can solve at least one of those problems by using Xvfb (The X Windows Virtual Frame Buffer).  Xvfb allows you to launch X windows (of which AFNI is one) without actually displaying the contents to your screen.

The basic setup works like this, you launch Xvfb with the settings for the screen dimensions (here 1024×768 with 24-bit depth).  Then call AFNI via the DISPLAY that Xvfb is responsible for.  AFNI will then open in this virtual frame buffer and do it’s thing.  First it will create a montage of the Axial view with a 6×6 setup, skipping three slices between each image.  Next, we will close the Sagittal image, set the underlay as the anat_final+orig dataset that uber_subject.py or afni_proc.py automatically generate.  Next it will turn off the functional autorange and set it to an arbitrary value of 10.  Next we load the stats dataset for the overlay and set the image to be centered in the window (center information retrieved from 3dCM (center mass).  Then we load the Coefficient and T-stat sub-briks for the condition of interest (first Print in this case), set the p-value to 0.001 and save a screen shot.  We do the same thing for the speech condition setting the sub-briks threshold and saving a screen shot.

centerC=`3dCM anat_final.${aDir}+orig`;

`which Xvfb` :1 -screen 0 1024x768x24 &

DISPLAY=:1 afni -com "OPEN_WINDOW A.axialimage mont=6x6:3 geom=600x600+800+600" \
-com "CLOSE_WINDOW A.sagittalimage" \
-com "SWITCH_UNDERLAY anat_final.${aDir}+orig" \
-com "SET_FUNC_AUTORANGE A.-" \
-com "SET_FUNC_RANGE A.10" \
-com "SWITCH_OVERLAY stats.${aDir}+orig" \
-com "SET_DICOM_XYZ A ${centerC}" \
-com "SET_SUBBRICKS A -1 13 14" \
-com "SET_THRESHNEW A .001 *p" \
-com "SAVE_JPEG A.axialimage ../snapshots/${aDir}_print.jpg" \
-com "SET_SUBBRICKS A -1 16 17" \
-com "SET_THRESHNEW A .001 *p" \
-com "SAVE_JPEG A.axialimage ../snapshots/${aDir}_speech.jpg" \
-com "QUIT"
killall Xvfb

At the end we kill the Xvfb.  There are cleaner ways to do this, but I usually don’t bother.  You can then of course take this setup and nest it in a loop to go through each subject.  In this case, we cd into each results directory created by afni_proc.py and then run the code below.  If you want to modify the code to use the separate plugout_drive program, you can see the previous blog post and merge it with this one.