Writing this post after the first in the series may seem somewhat backwards! Last time we covered reading in data from individual subjects and plotting them as box plots with error bars in R. This time we’ll do something even more straightforward – plotting ROI group effects. If you haven’t already read it, there are a variety of ways to make ROIs in AFNI (including how to make them from pre-existing coordinates). You might also want to review how to combine several ROIs into a single mask (part 1, part 2) for use with AFNI. Ready?
So you’ve run some type of group analysis, let’s make it simple and say that you ran 3dttest++ (review here), and make it even more simple and say that you either 1) used the -brickwise option to perform all of the t-tests and have them in a single file (see how here), or 2) you concatenated your t-test results into a single file using 3dbucket. At this point you have a single HEAD/BRIK pair (or NIFTI) file that contains multiple sub-bricks. The great news is that you can extract the necessary data from these to plot your group effects!
The first thing you should do is look at the structure of your group analysis file, which should look something like what is shown below.
 -- At sub-brick #0 'con_1_Mean' datum type is float: -3.33262 to 5.03709
 -- At sub-brick #1 'con_1_Tstat' datum type is float: -5.8228 to 14.9712
 statcode = fitt; statpar = 13
 -- At sub-brick #2 'con_2_Mean' datum type is float: -3.35317 to 5.65061
 -- At sub-brick #3 'con_2_Tstat' datum type is float: -6.88651 to 16.3167
 statcode = fitt; statpar = 13
 -- At sub-brick #4 'con_3_Mean' datum type is float: -3.64771 to 5.21773
 -- At sub-brick #5 'con_3_Tstat' datum type is float: -7.4722 to 15.4066
 statcode = fitt; statpar = 13
Here you can see I have three conditions, each has a Mean and a t-statistic. For plotting purposes, I’m just going to need the mean values and for now I’ll ignore the t-values. If I simply want to get all of the values out of the group file within an ROI (say Left STG), I can use 3dROIstats:
3dROIstats -mask L_STG_small+tlrc. t.test_val+tlrc.'[0..5]'
File Sub-brick Mean_1
t.test_val+tlrc.[0..5] 0[con_1_] 0.400111
t.test_val+tlrc.[0..5] 1[con_1_] 1.979007
t.test_val+tlrc.[0..5] 2[con_2_] 0.289859
t.test_val+tlrc.[0..5] 3[con_2_] 1.398176
t.test_val+tlrc.[0..5] 4[con_3_] 0.239496
t.test_val+tlrc.[0..5] 5[con_3_] 1.129553
And this by itself is generally helpful because I could read this into R and then figure out which values are means and which are t-stats. But that’s additional work that you don’t necessarily HAVE to do, because AFNI makes it easy to just select EVERY OTHER sub-brick (using the parentheses in the sub-brick selector).
3dROIstats -mask L_STG_small+tlrc. t.test_val+tlrc.'[0..5(2)]'
File Sub-brick Mean_1
t.test_val+tlrc.[0..5(2)] 0[con_psw1_] 0.400111
t.test_val+tlrc.[0..5(2)] 1[exc_psw1_] 0.289859
t.test_val+tlrc.[0..5(2)] 2[uncon_psw] 0.239496
Now if you save that information to a file (using pipes in linux/unix/mac), you can make that the input for other programs (1dplot or R).
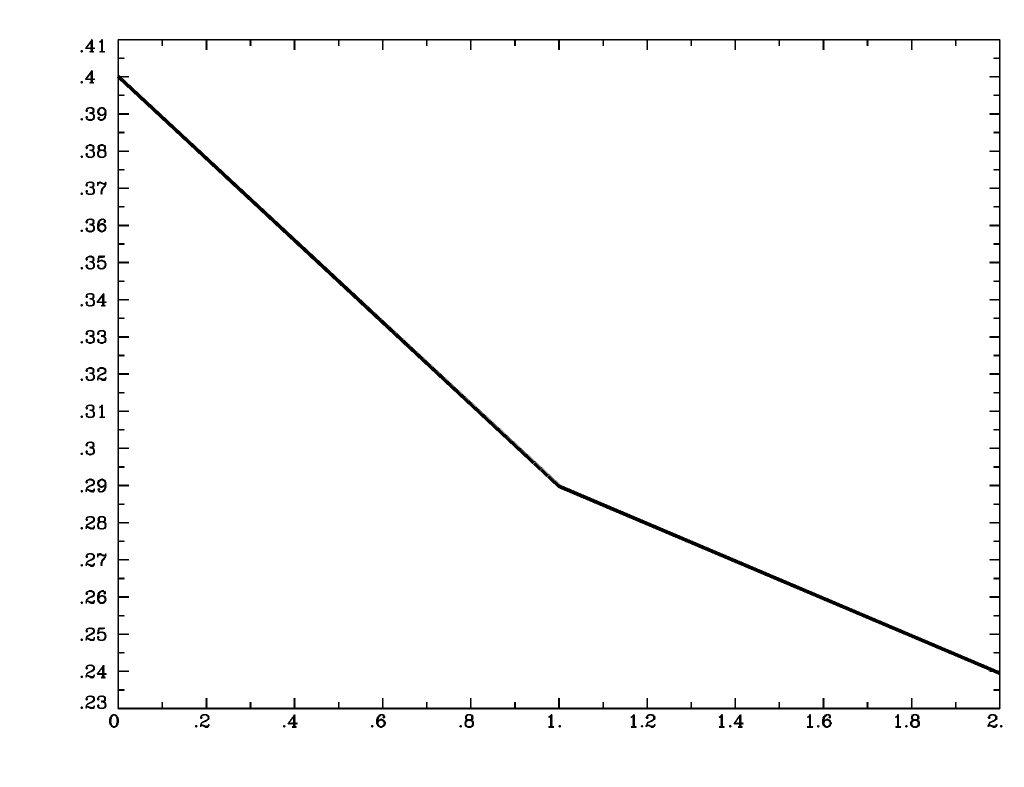
3dROIstats -mask L_STG_small+tlrc. t.test_val+tlrc.'[0..5(2)]' > values.txt
1dcat values.txt[2]{1..$} | 1dplot -stdin
or read them into R:
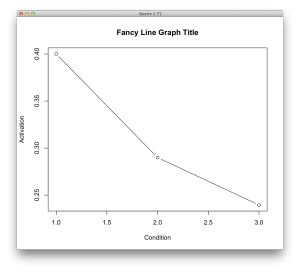
thedata = read.table(file.choose(), sep='\t', header=T)
plot(thedata$Mean_1, type='b', xlab='Condition', ylab='Activation', main='Fancy Line Graph Title)
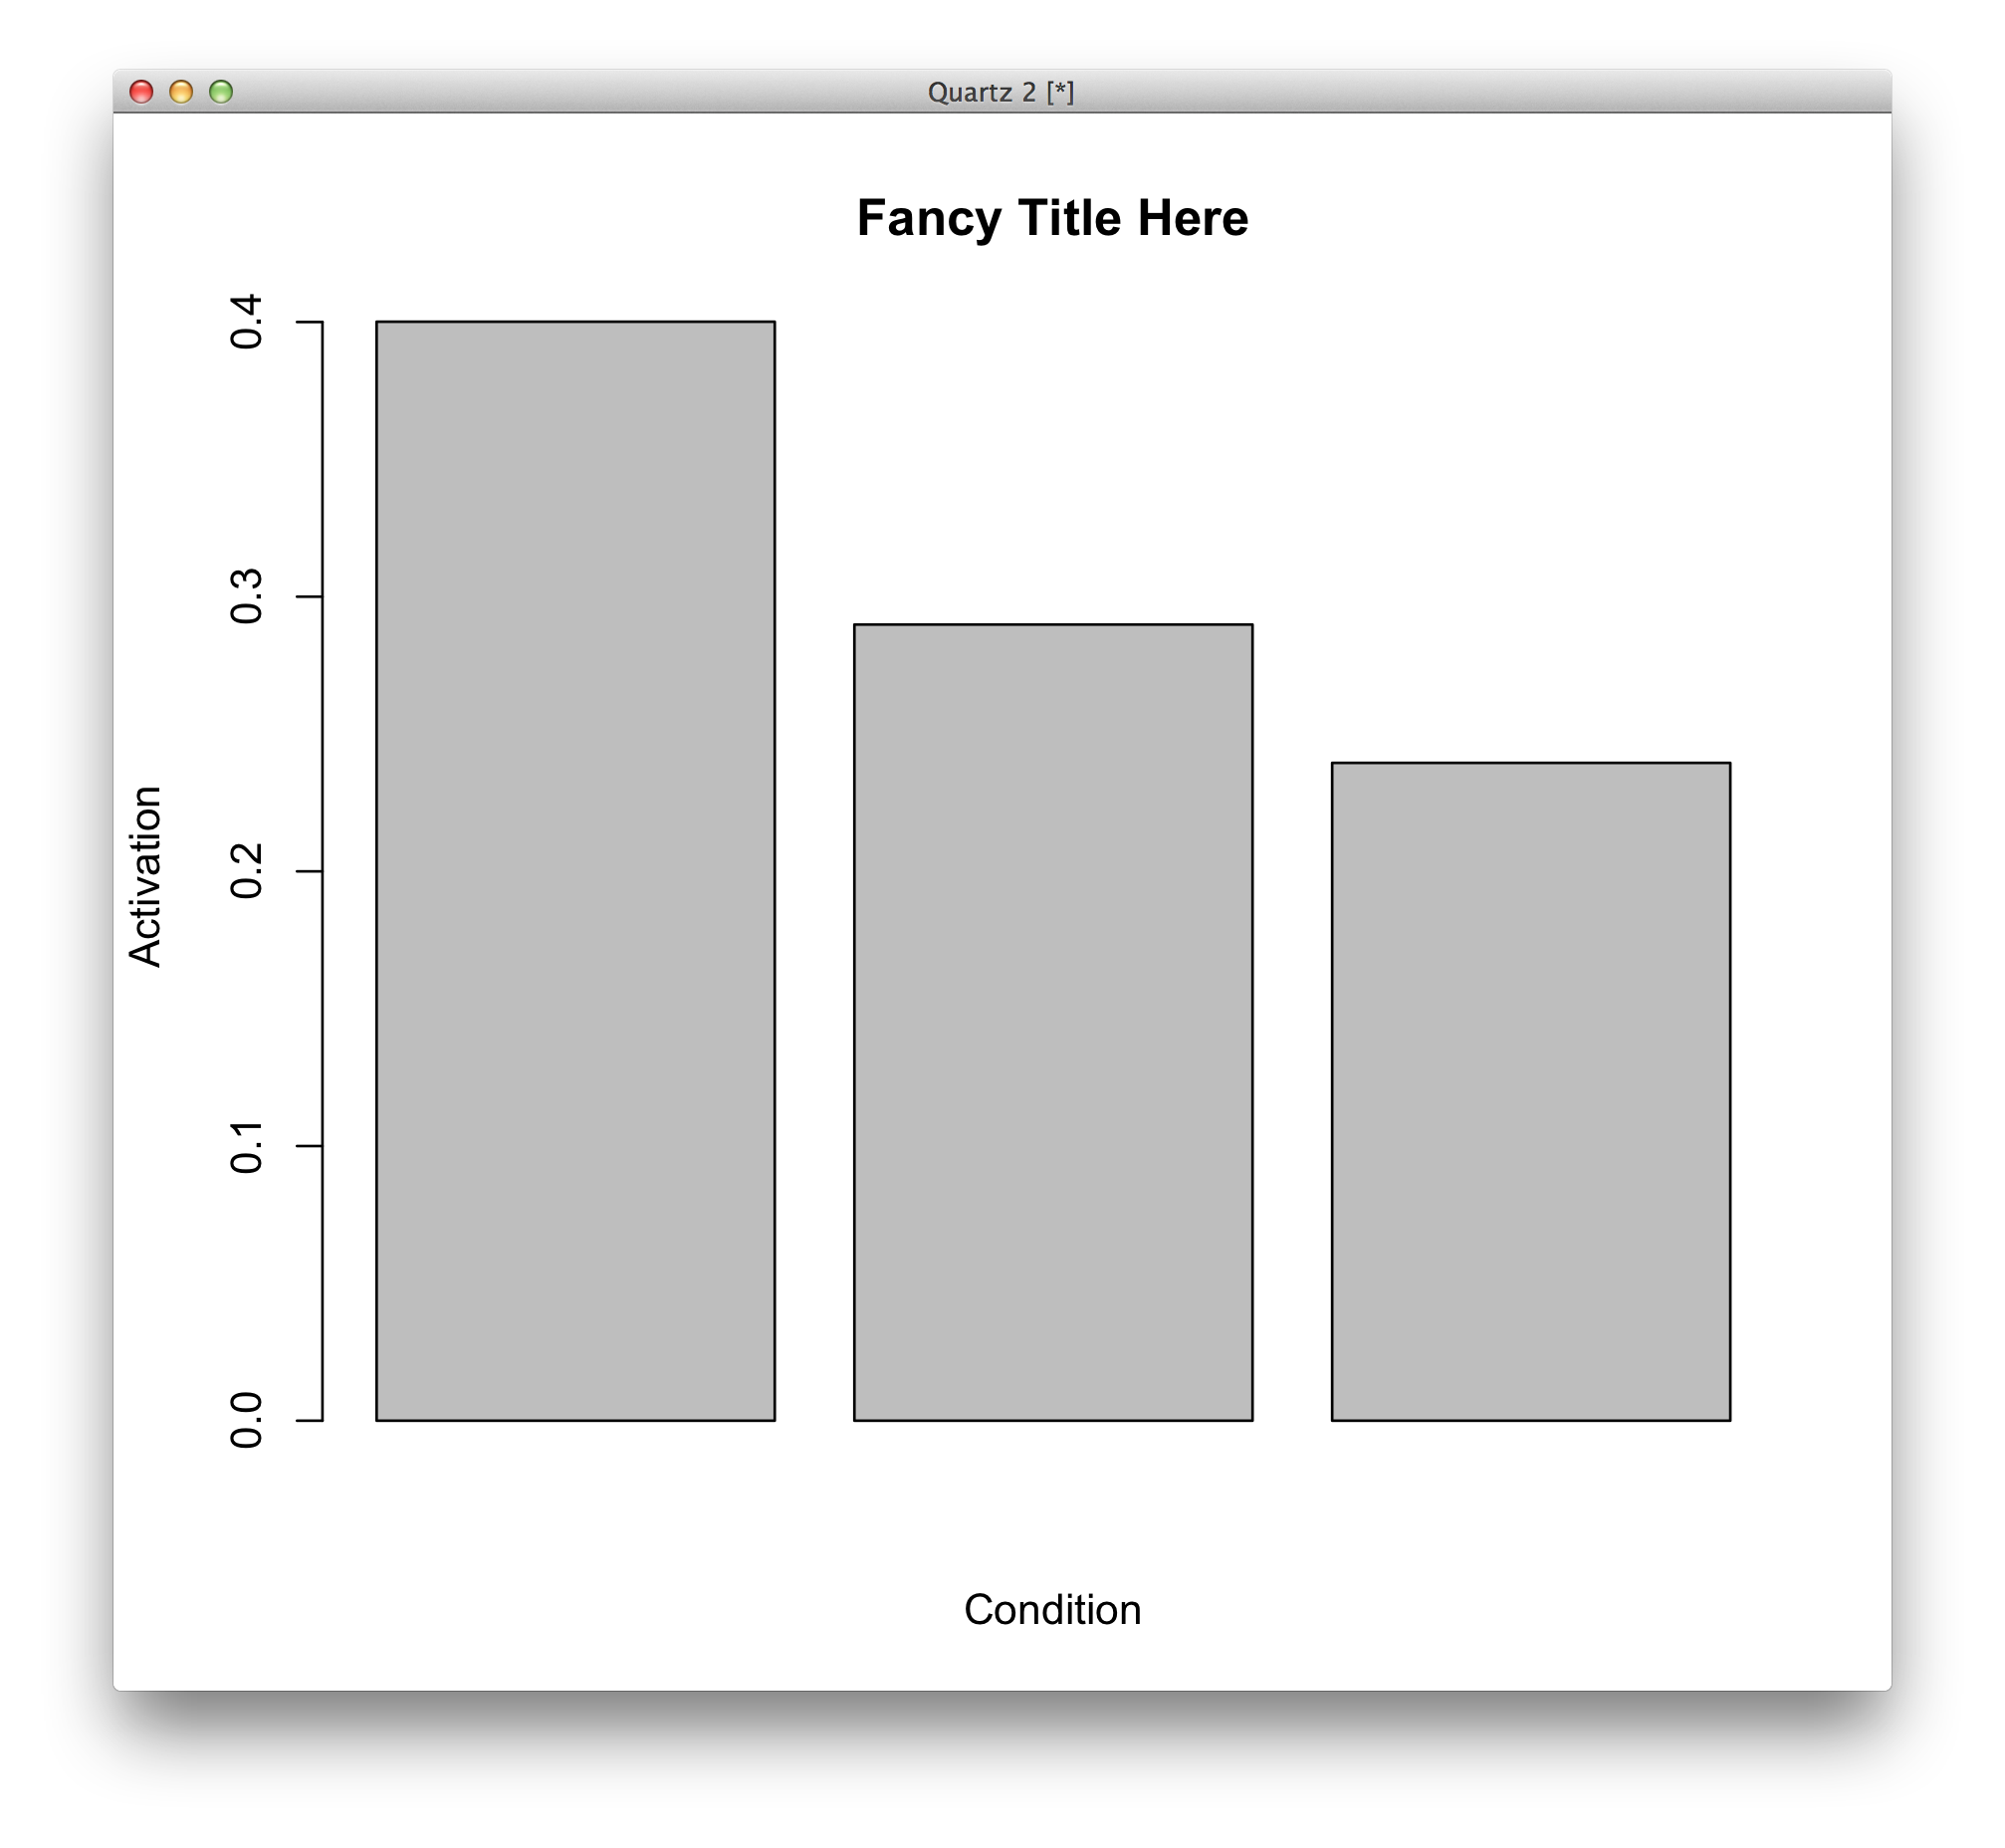
 Or you can make a fancy bar-plot:
barplot(thedata$Mean_1, xlab='Condition',ylab='Activation', main='Fancy Title Here')
Or you can make a fancy bar-plot:
barplot(thedata$Mean_1, xlab='Condition',ylab='Activation', main='Fancy Title Here')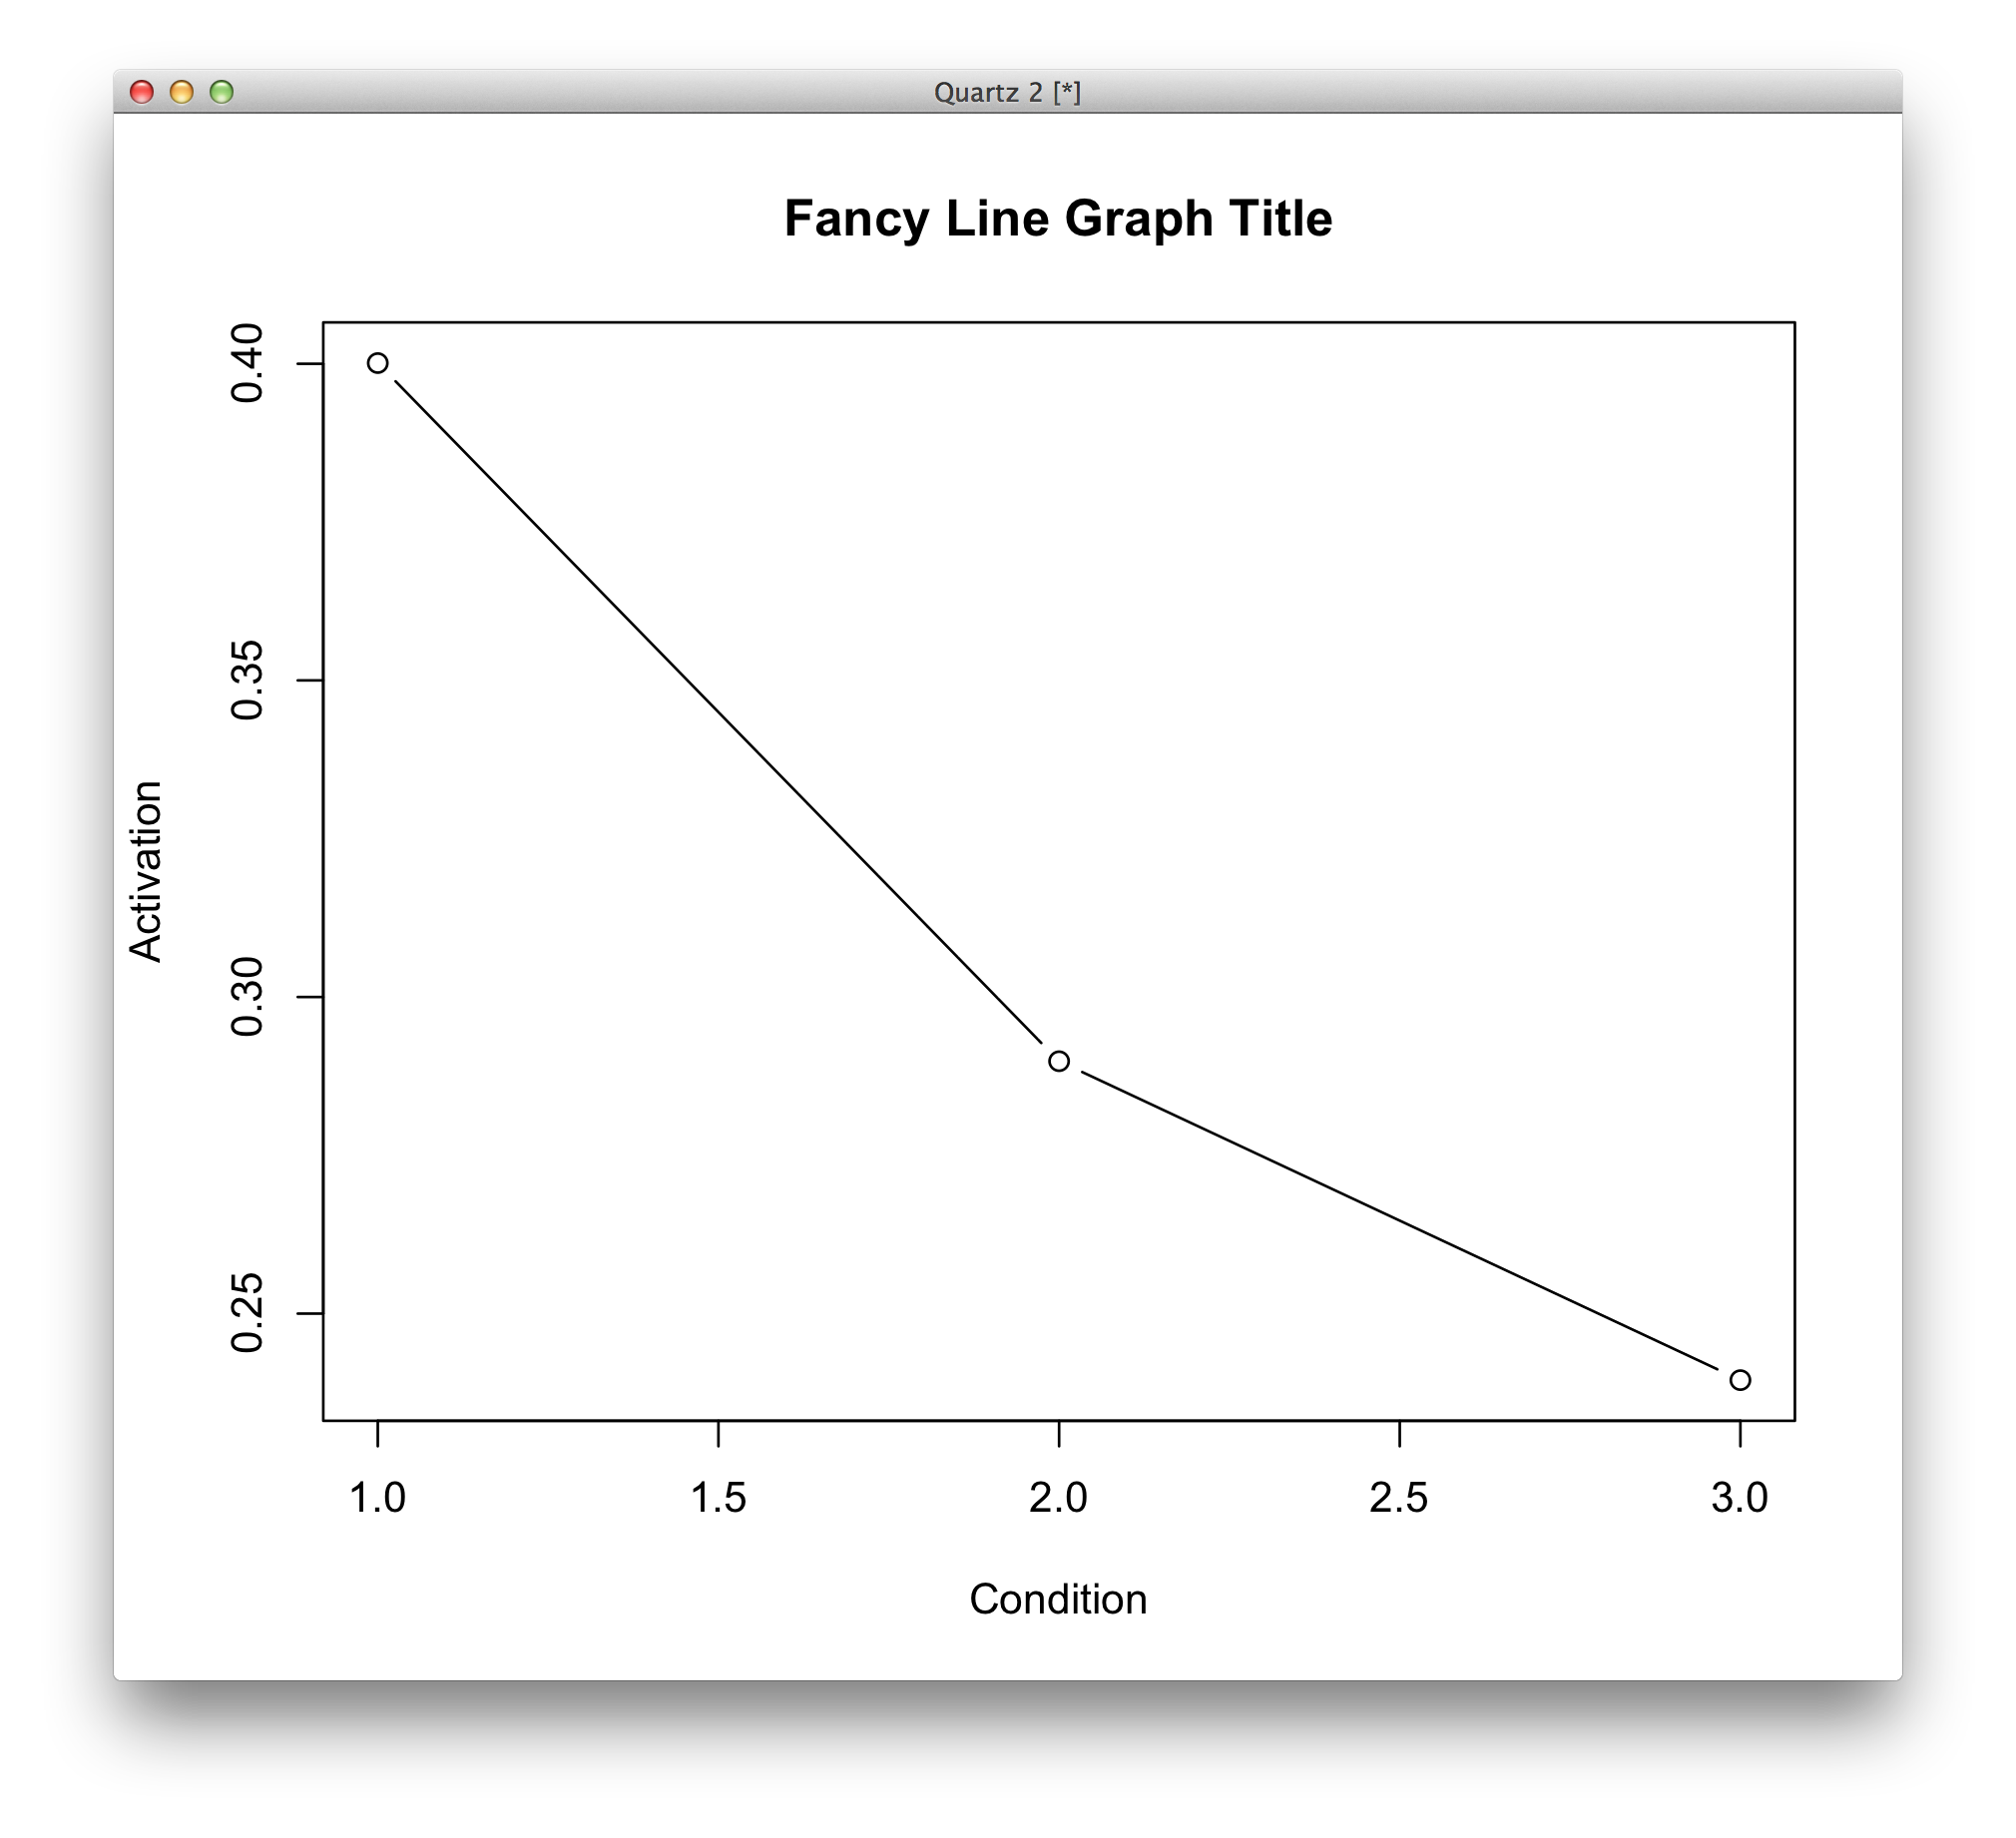
This concludes the quick plotting of today in R. I’m working on a few interesting projects right now and hope to post something about them very very soon!